
Indicators for NinjaTrader 8
The same tools as the home page. Open an indicator to read what it draws.
 Preview image
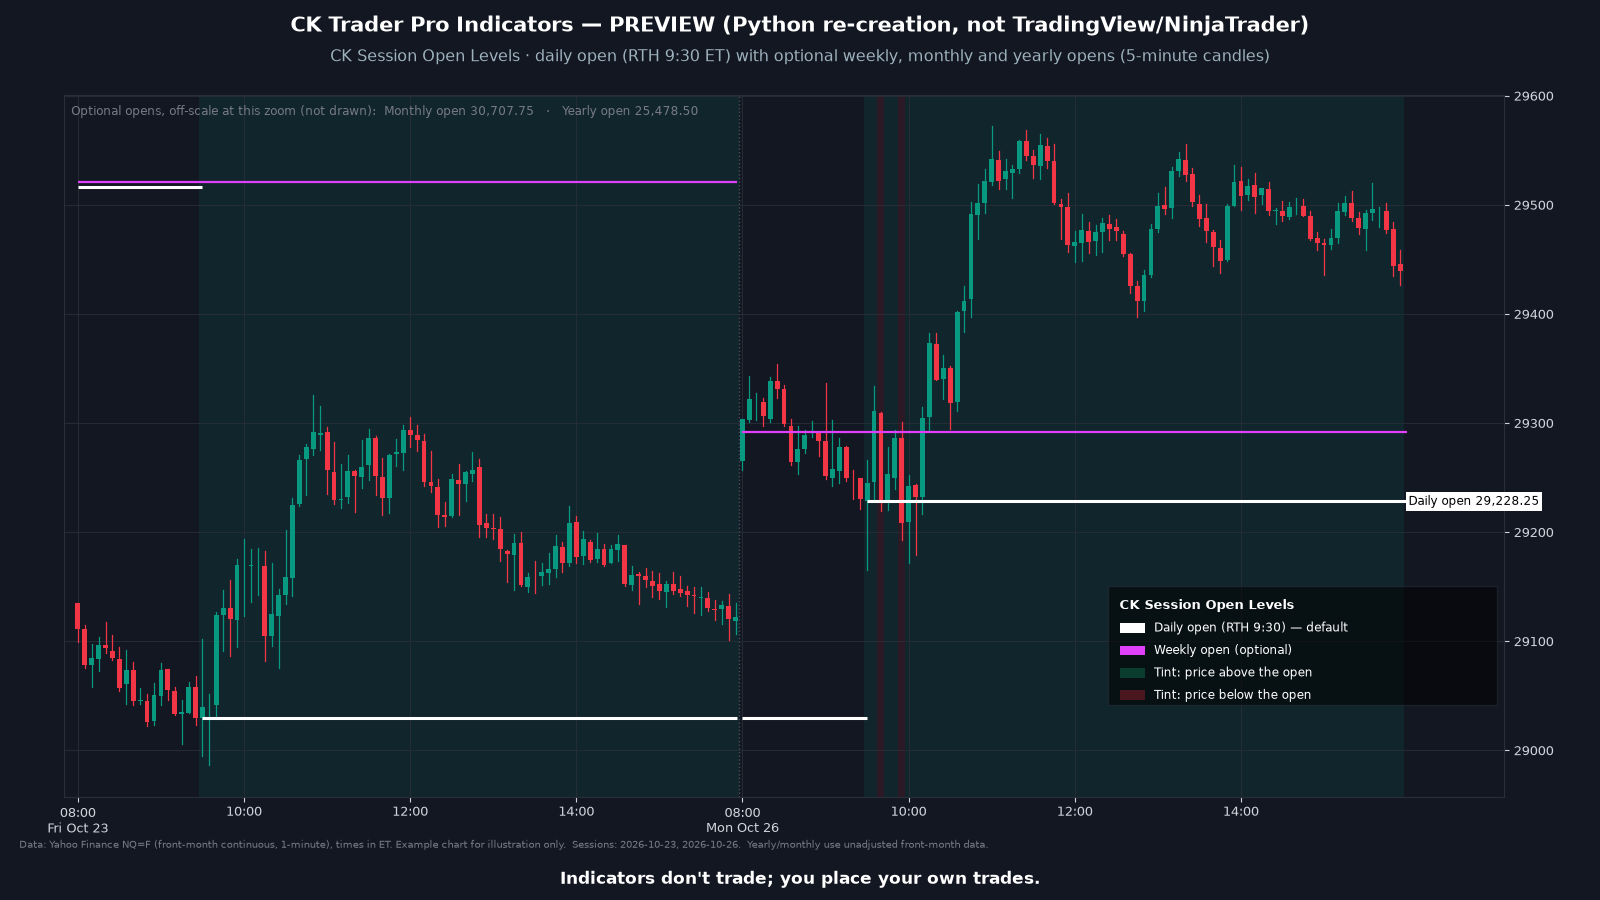
CK Session Open Levels
Draws the daily open, with optional weekly, monthly and yearly opens, as horizontal levels and tints whether price is above or below the daily open.
View details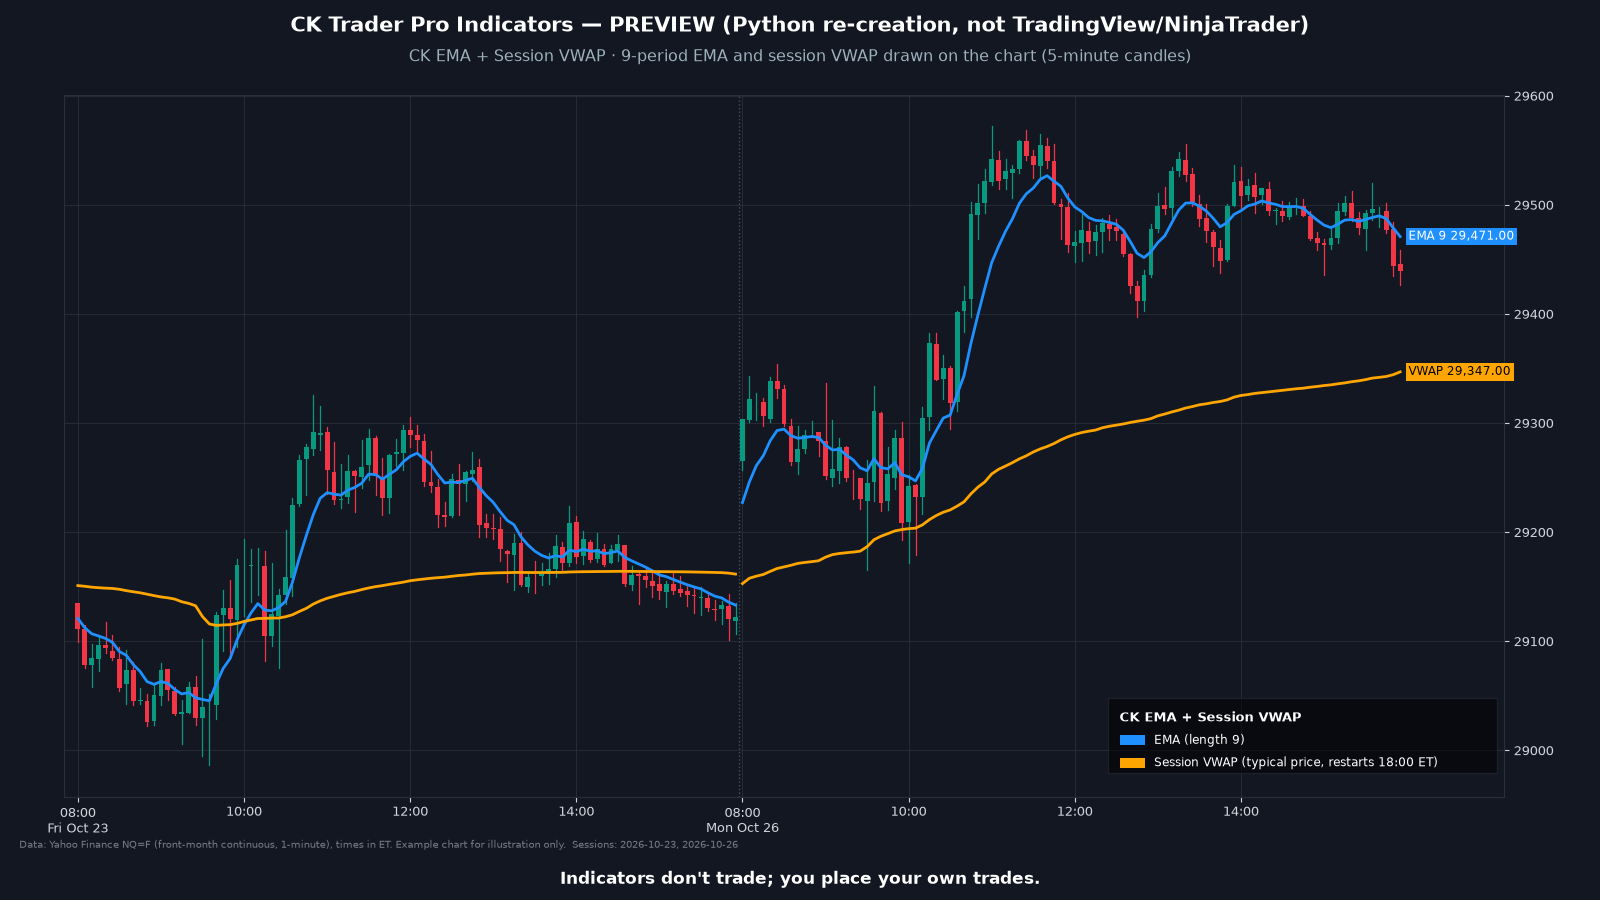 Illustration, not market data
CK EMA + Session VWAP
Draws an exponential moving average and a session VWAP on your chart as two context lines. The EMA length is adjustable.
View details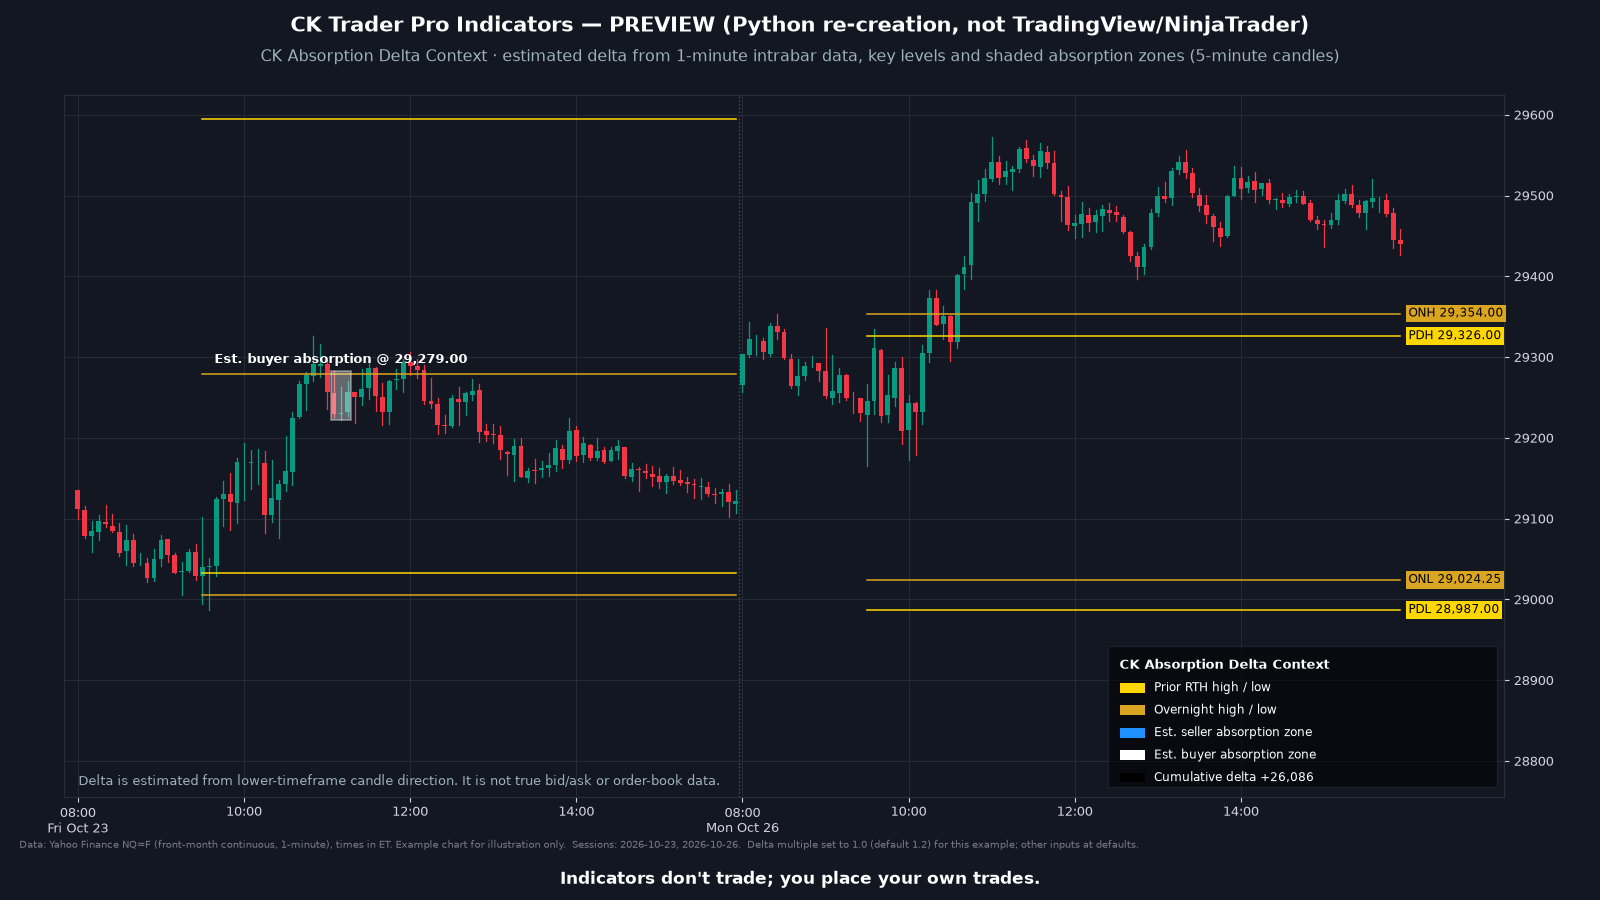 Illustration, not market data
CK Absorption Delta Context
Estimates delta for each bar from finer intrabar data and shades zones labeled Est. seller absorption and Est. buyer absorption at key levels. Delta is estimated from lower-timeframe candle direction. It is not true bid/ask or order-book data.
View details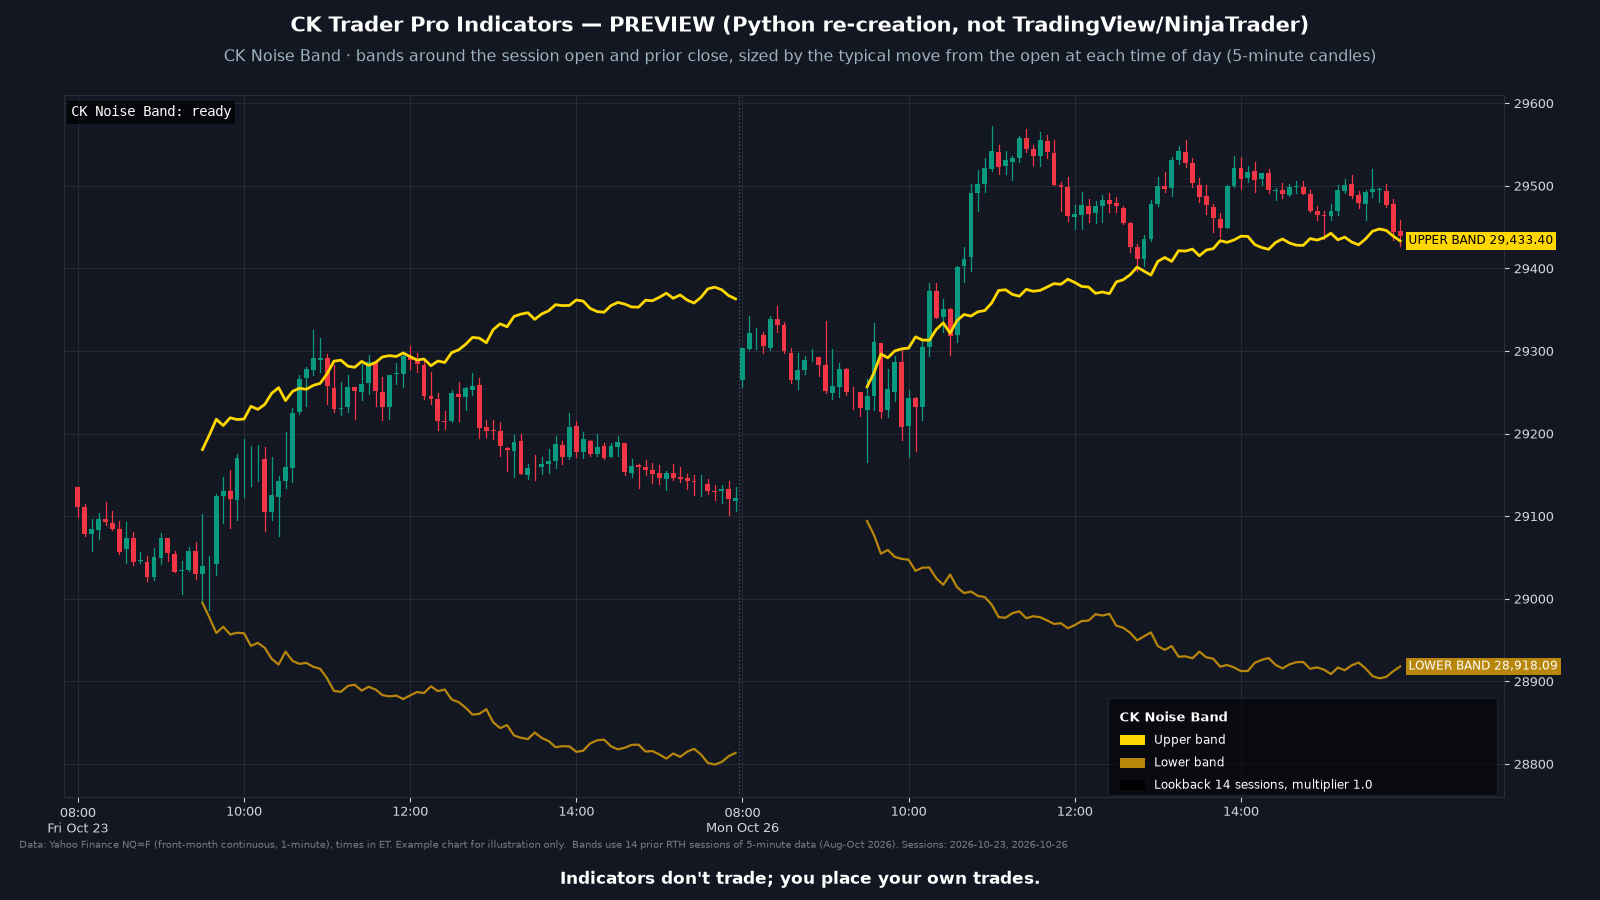 Illustration, not market data
CK Noise Band
Draws an upper and a lower band around the session open and prior close, sized by how far price has typically moved from the open at that time of day over recent sessions.
View details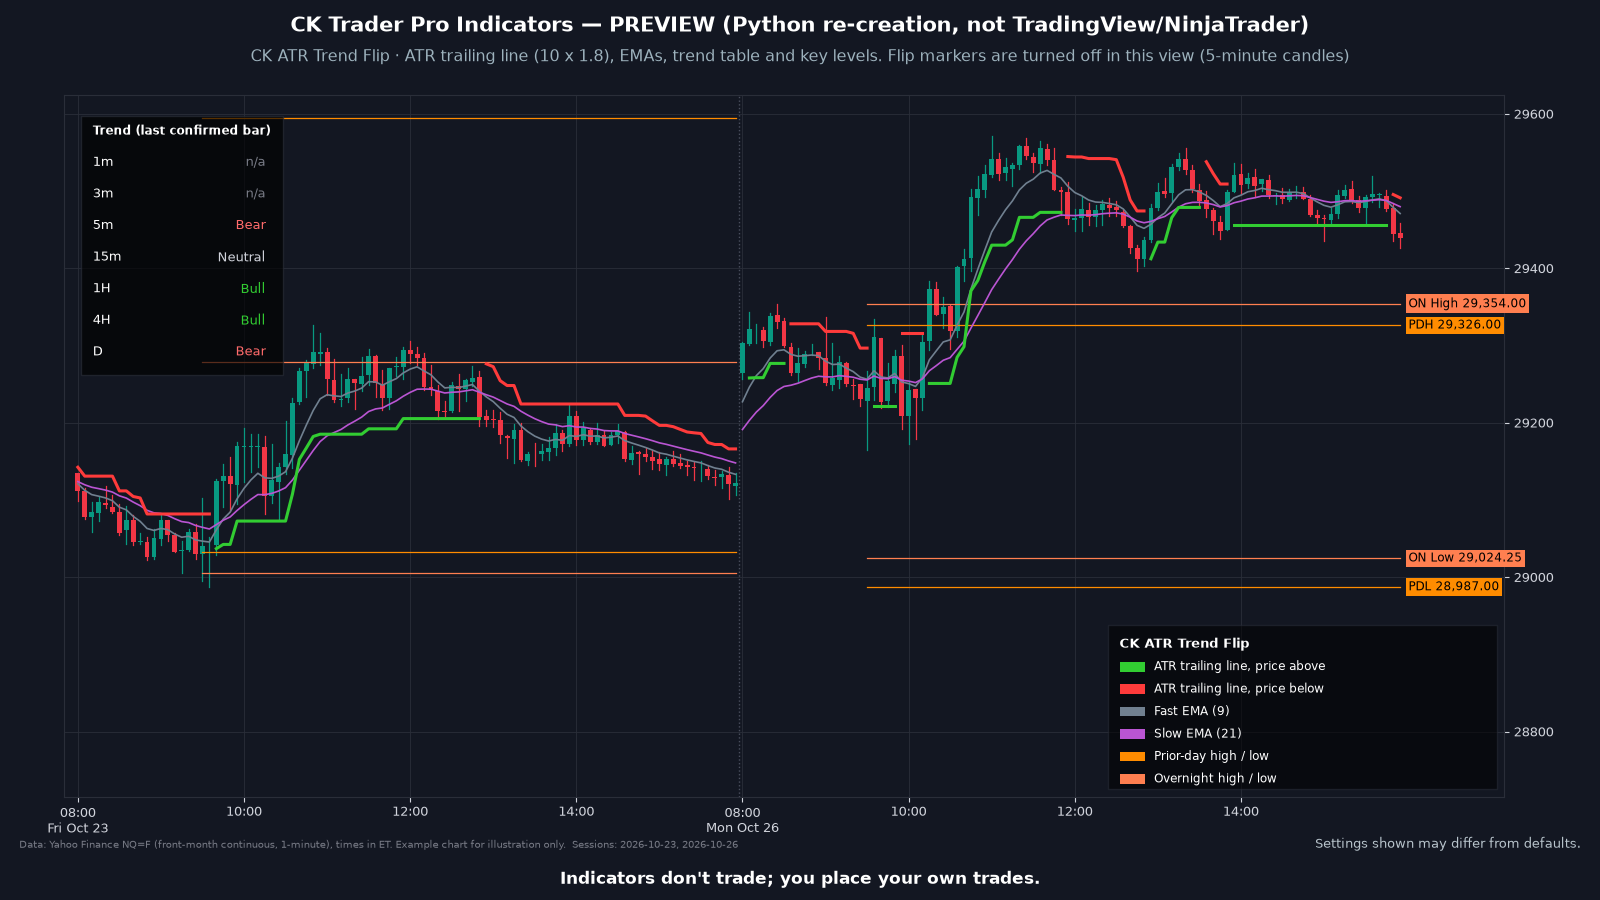 Illustration, not market data
CK ATR Trend Flip
Marks bars labeled Up flip or Down flip when price flips an ATR trailing stop in the direction of an EMA trend filter. Also shows a trend table for seven timeframes and prior-day, Asia, London and overnight levels. Display only.
View details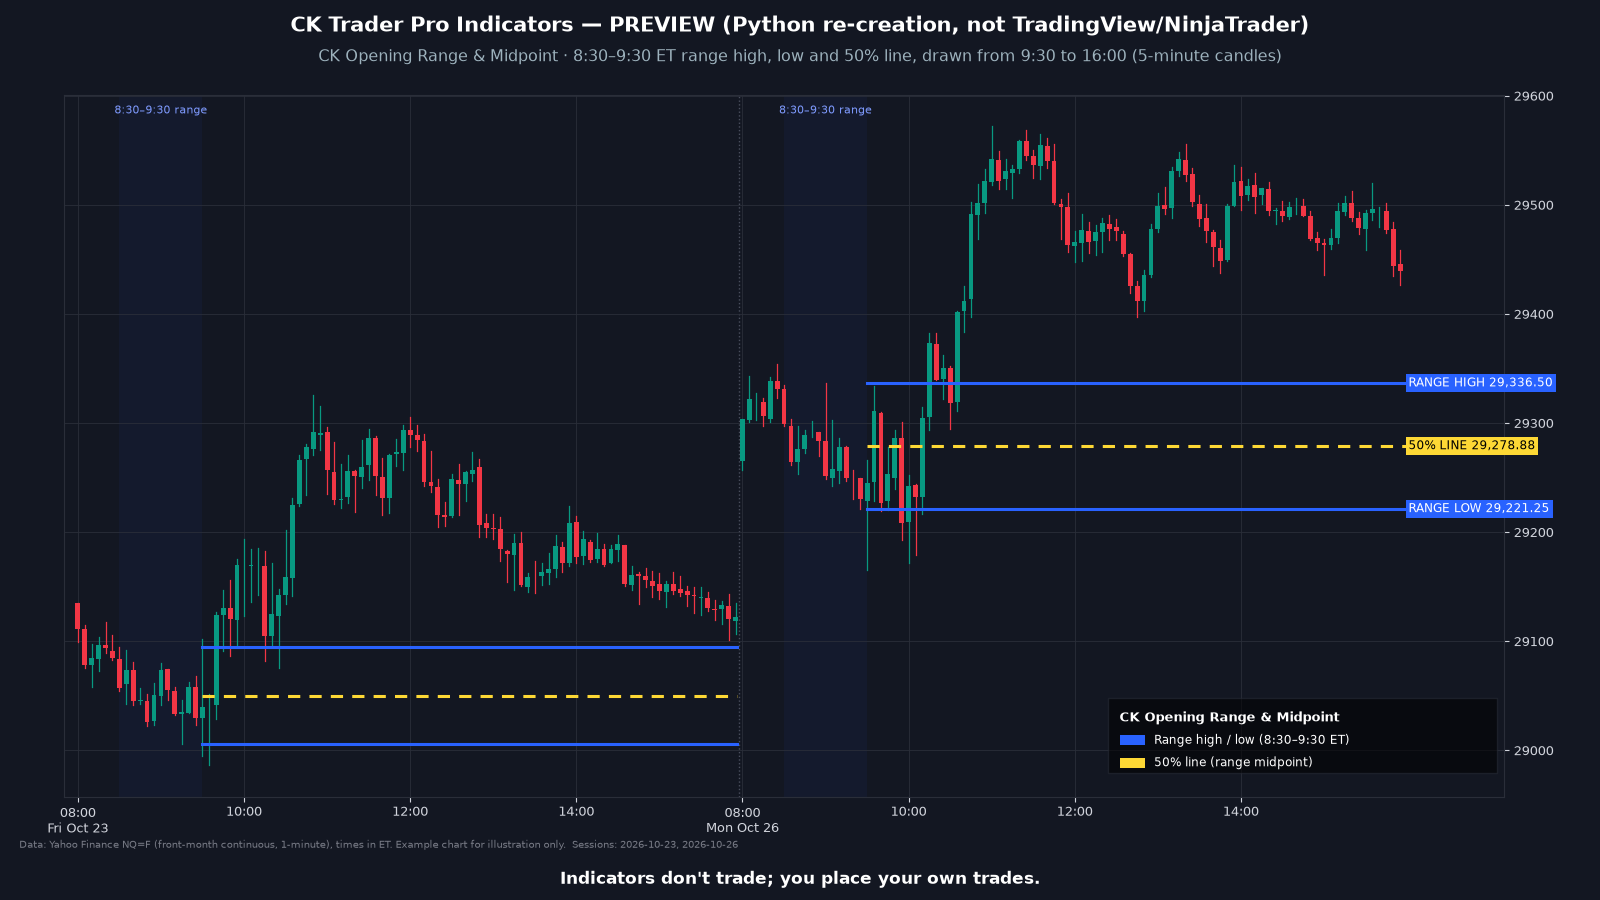 Preview image
CK Opening Range & Midpoint
Draws the 8:30 to 9:30 ET range high, range low and 50% midpoint as levels through the end of the session.
View details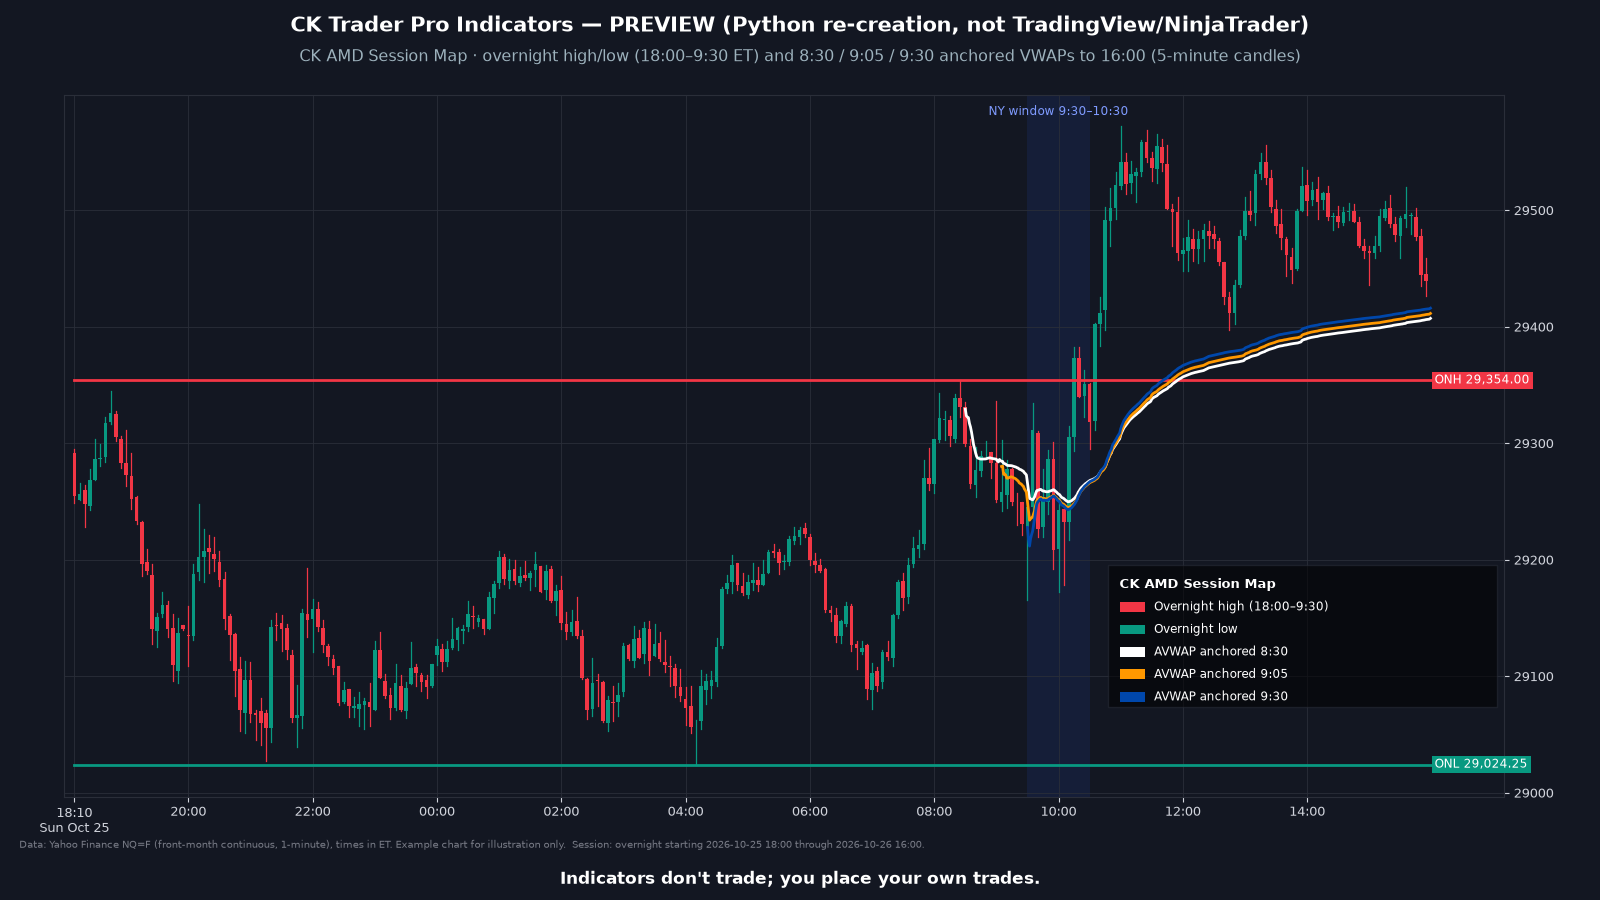 Preview image
CK AMD Session Map
Draws the overnight high and low and three anchored VWAPs (8:30, 9:05 and 9:30 ET), with the 9:30 to 10:30 window shaded for context.
View details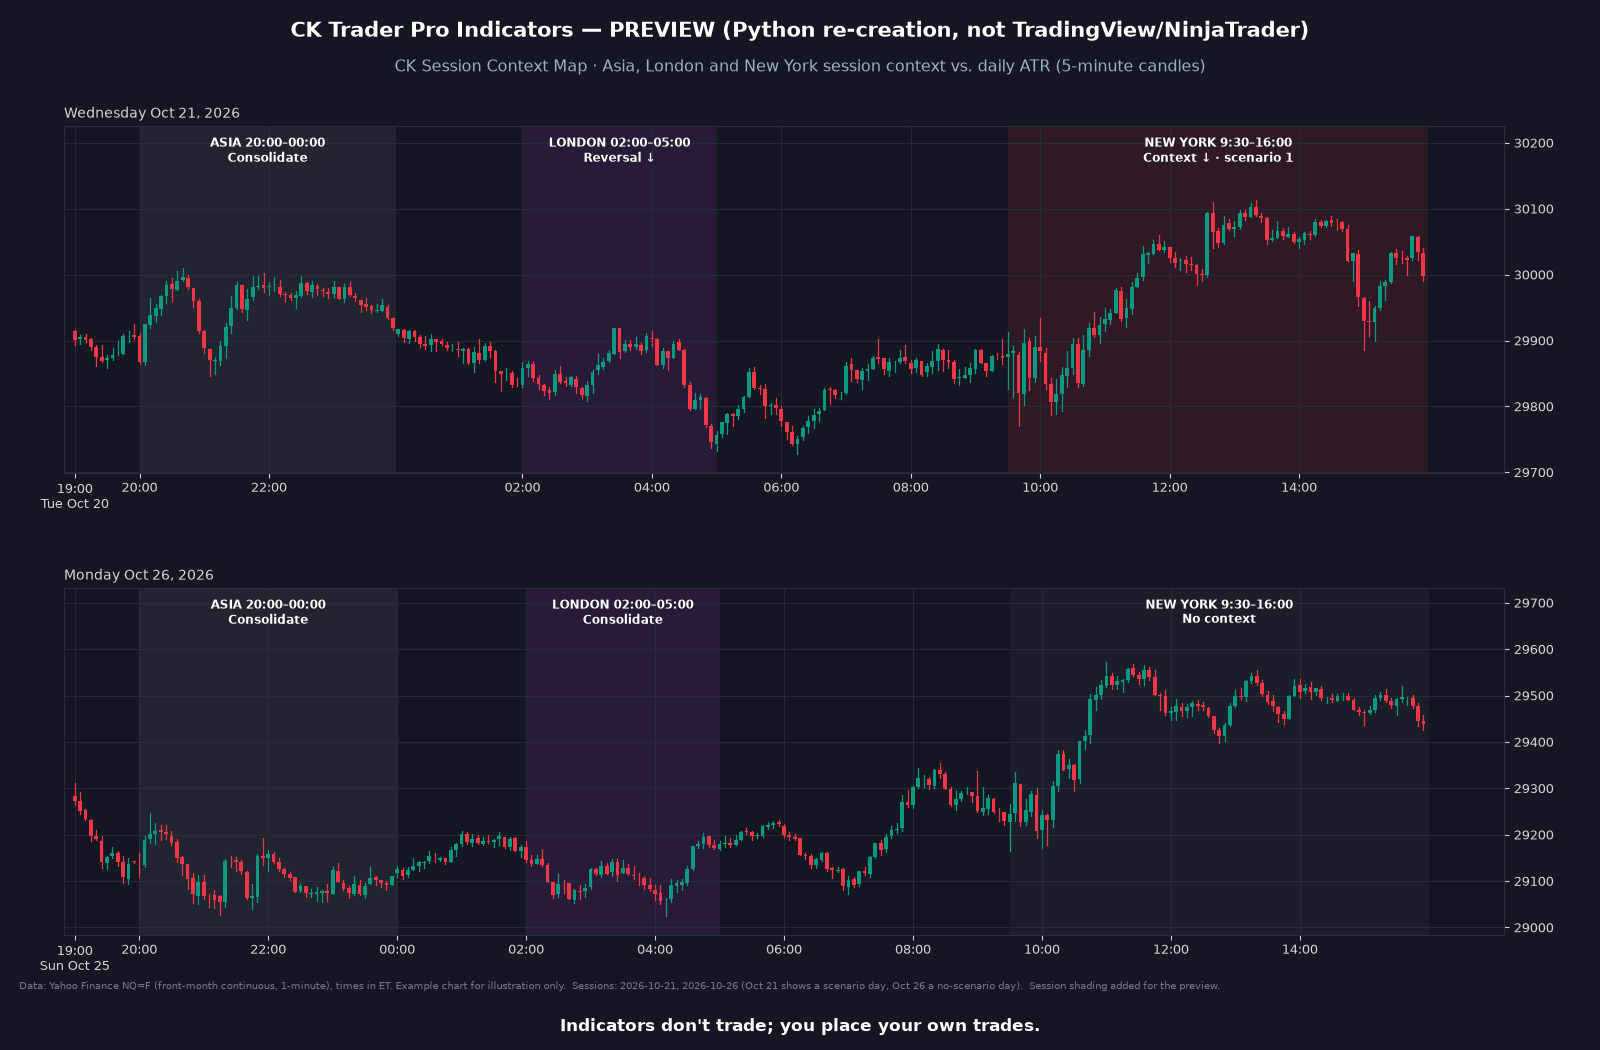 Preview image
CK Session Context Map
Shades the Asia, London and New York sessions and labels each as consolidation, continuation or reversal compared with the daily average range, for context.
View details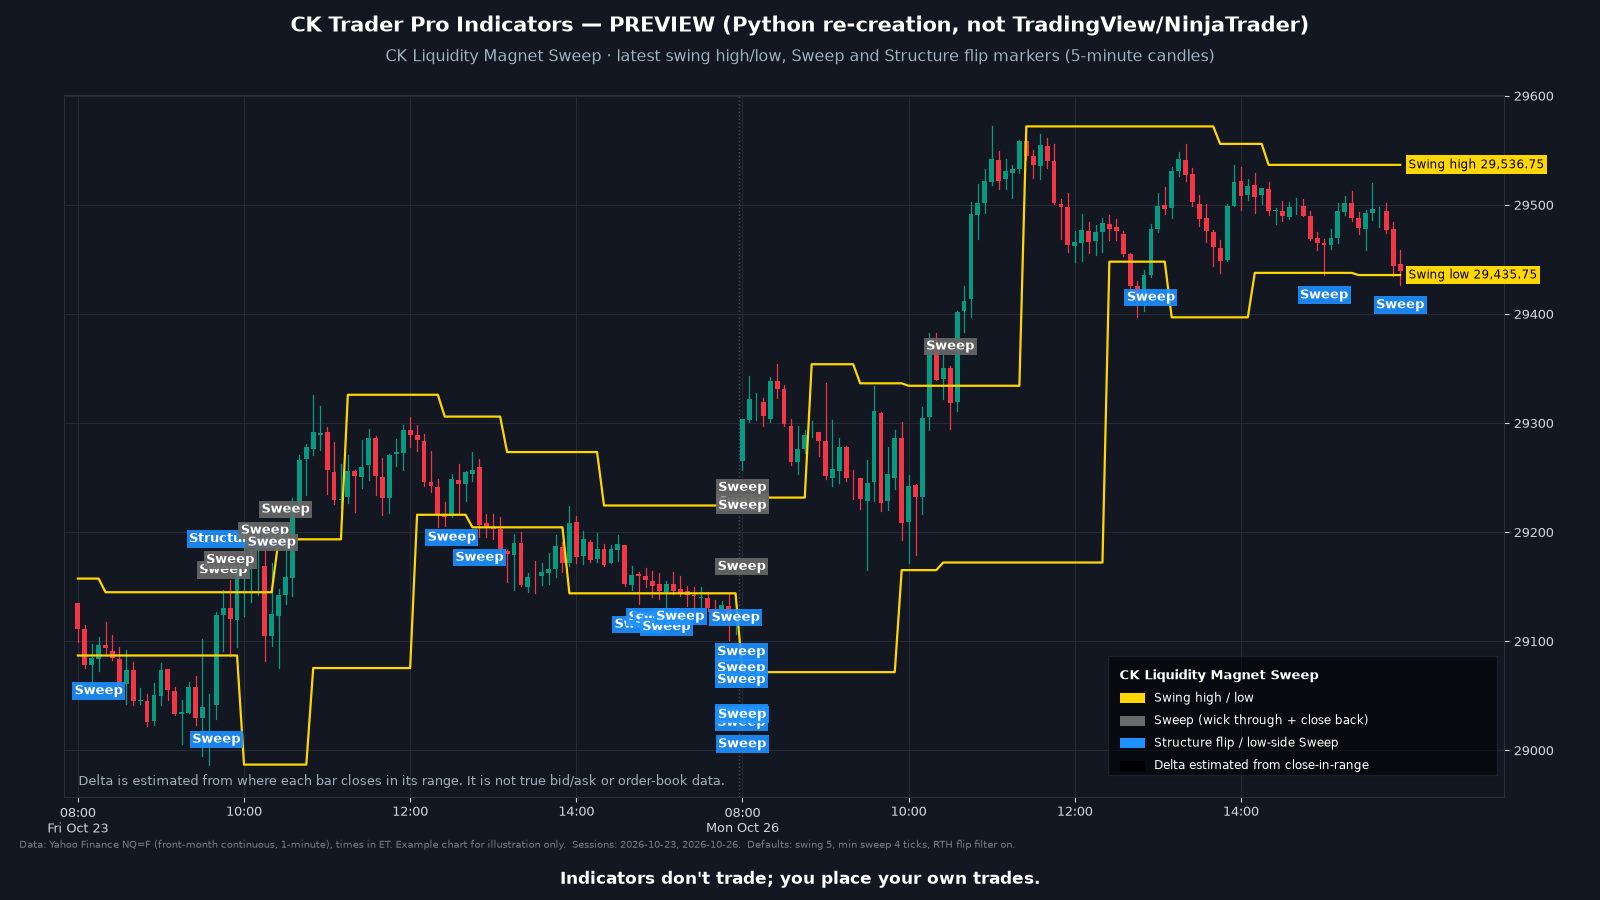 Preview image
CK Liquidity Magnet Sweep
$139 lifetime or $25/month. Sold separately; not included in the All-8 Bundle.
View details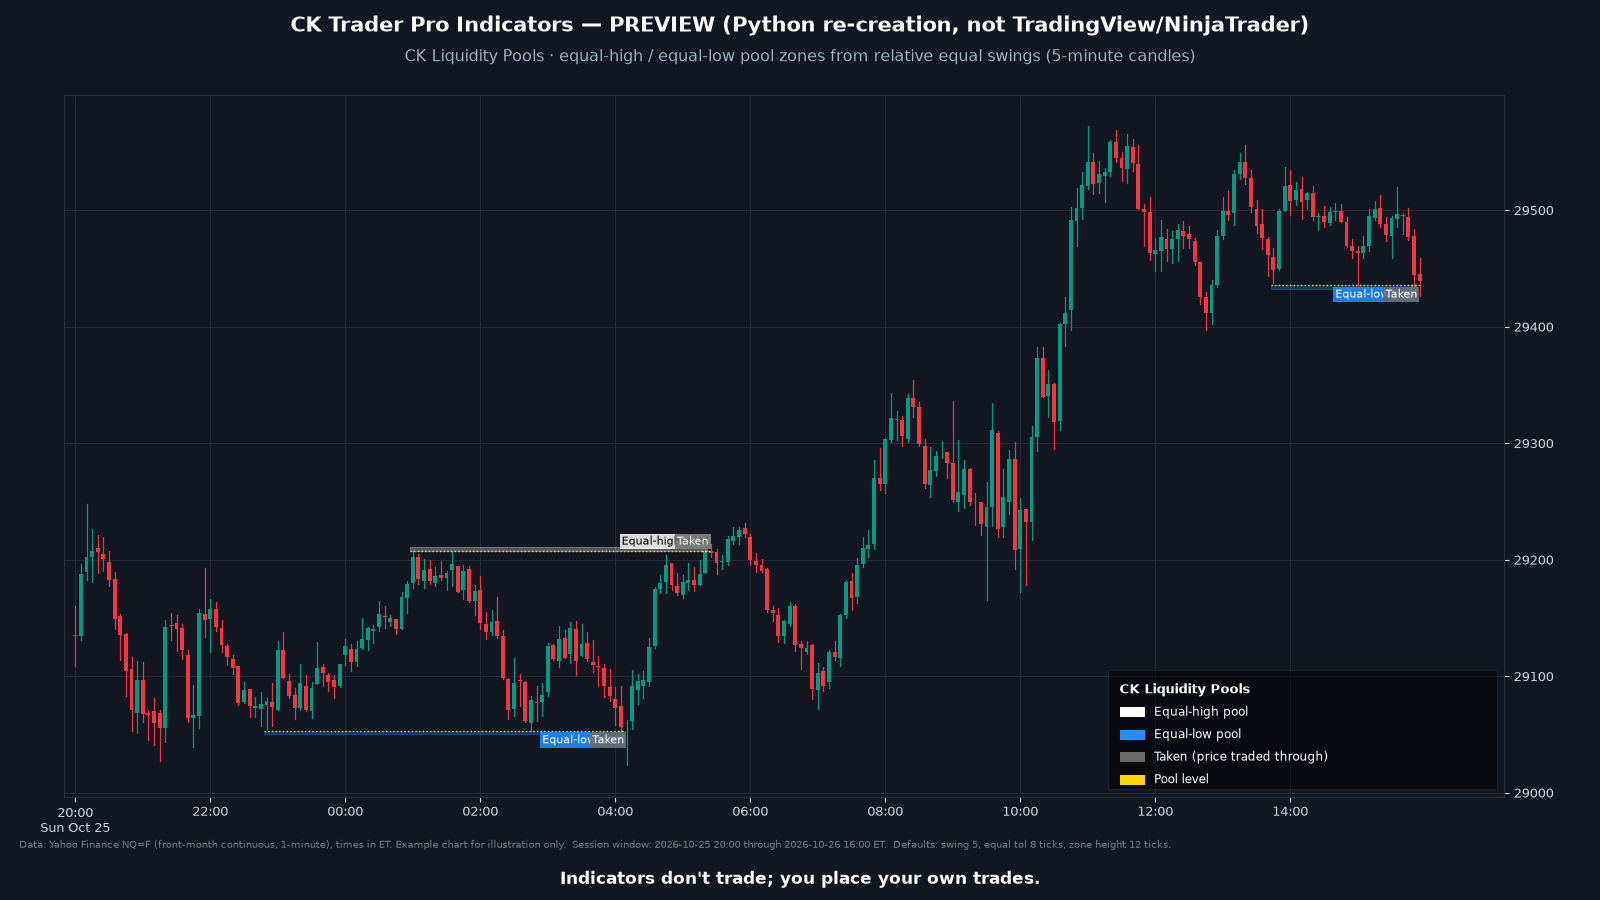 Preview image
CK Liquidity Pools
$139 lifetime or $25/month. Sold separately; not included in the All-8 Bundle.
View details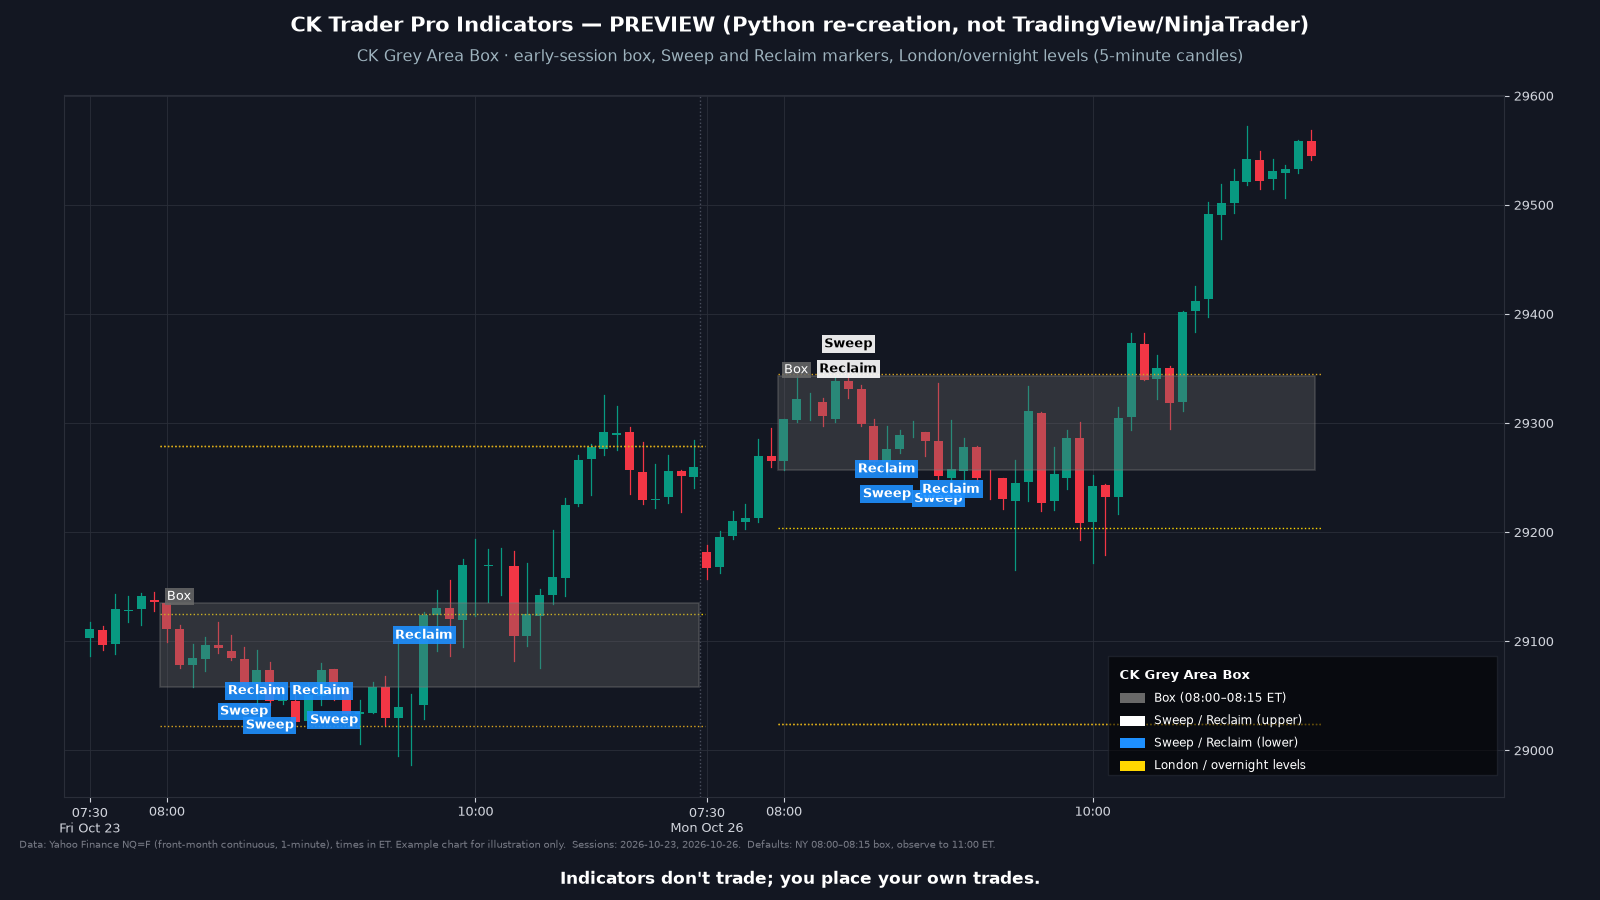 Preview image
CK Grey Area Box
$139 lifetime or $25/month. Sold separately; not included in the All-8 Bundle.
View details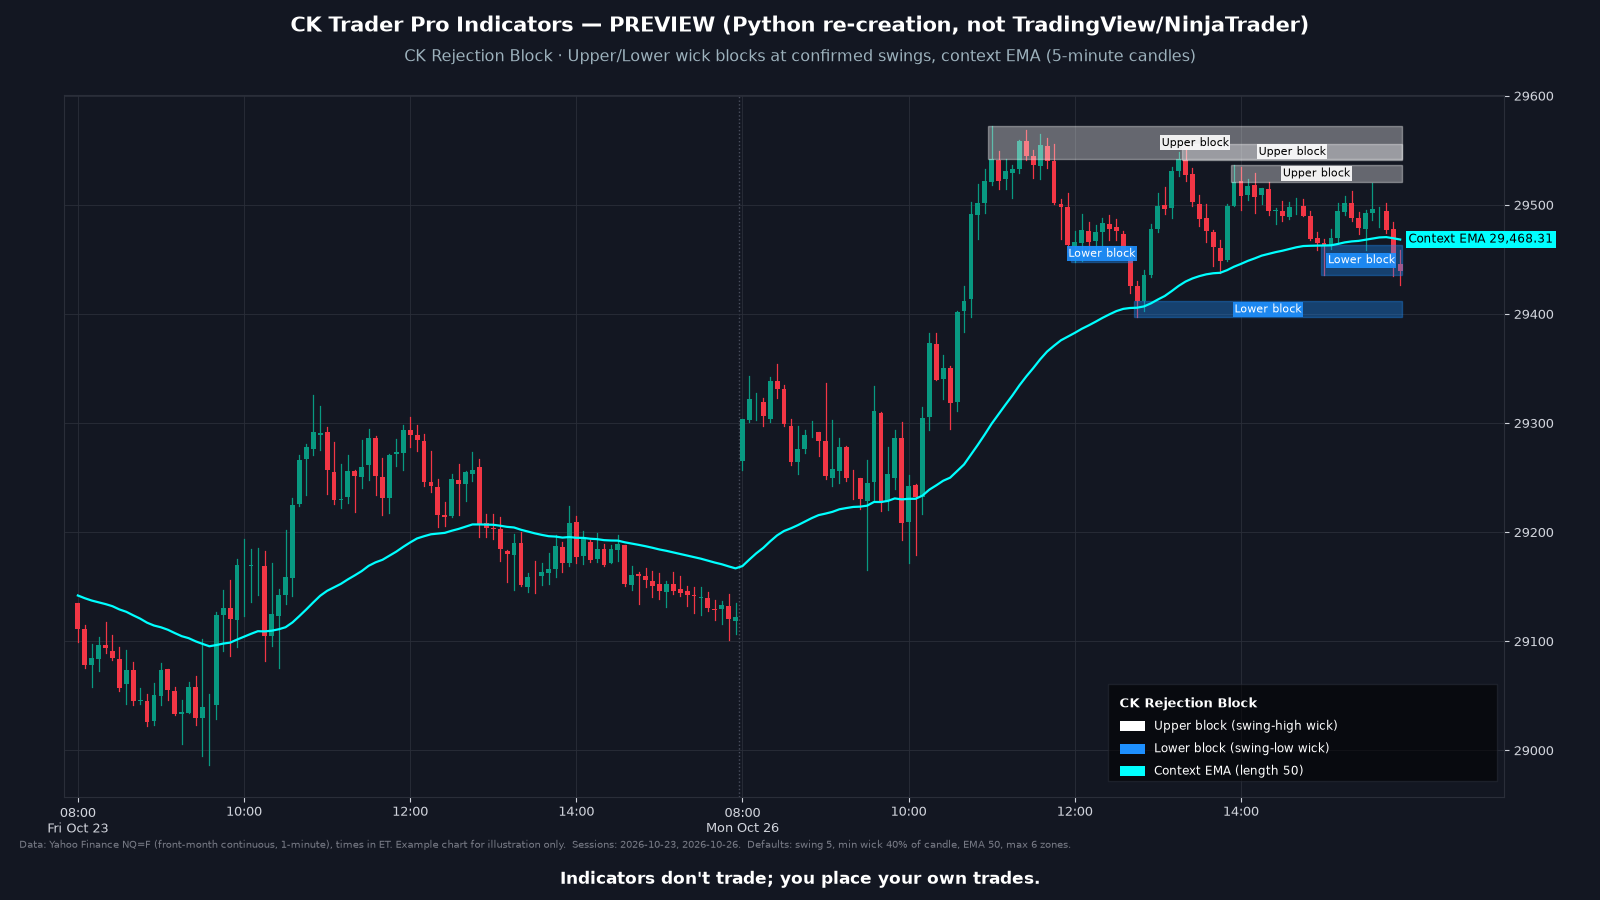 Preview image
CK Rejection Block
$139 lifetime or $25/month. Sold separately; not included in the All-8 Bundle.
View details